Performance of Social Media Promotion Services
A number of Social Media Platforms are available on the market offering promotion services. These social media promotion service providers are not specialized on any streaming platforms (e.g. Spotify, Apple Music), however, they sometimes contain data on the preferred streaming platforms of their users. Different criteria like e.g. target groups, geographical regions, promotion targets, and campaign lengths can be defined prior to start of the campaigns in some cases.
Up to now, I mainly worked with the two big players of them, Facebook Ads (Facebook.com), Instagram Ads (Facebook.com). Google / YouTube Ads have not been used so far.
In this episode of the series, the results of the non-paid ("organic") information campaigns are evaluated and discussed.

The graph "Campaign Rankings" gives an overview of the different types of promotion campaigns (IG: Instagram; FB: Facebook) and categorizes them in five arbitrary groups:
rank 5) New Song (highest ranking category)
rank 4) Music video
rank 3) Live contribution
rank 2) Behind the scenes / blogs
rank 1) News / other blog topics (lowest ranking category)
The 'New Songs' category is assiciated to the highest ranking since this is what (DIY) musicians regularly should do, especially in these times where streaming and social media platforms change the way how music is consumed. The CEO of Spotify recently noticed that musicians are expected to release quite regularly / frequently across the year. This is putting a lot of pressure on the shoulders especially of DIY musicians, who need not only to be creative but also need to act on their marketing and promotion - otherwise, the newly released music will probably not find the right fan base. The other categories rank in a decreasing order with 'News / Other Blogs' at the lower end of the arbitrary.
As easily recognizable, the majority of the non-paid info ads fall in the category 'New Song' (rank 5). Two ads are associated with 'Behind the Scenes / blogs' category, only one ad is belonging to 'News / other blog topics' (rank 1).
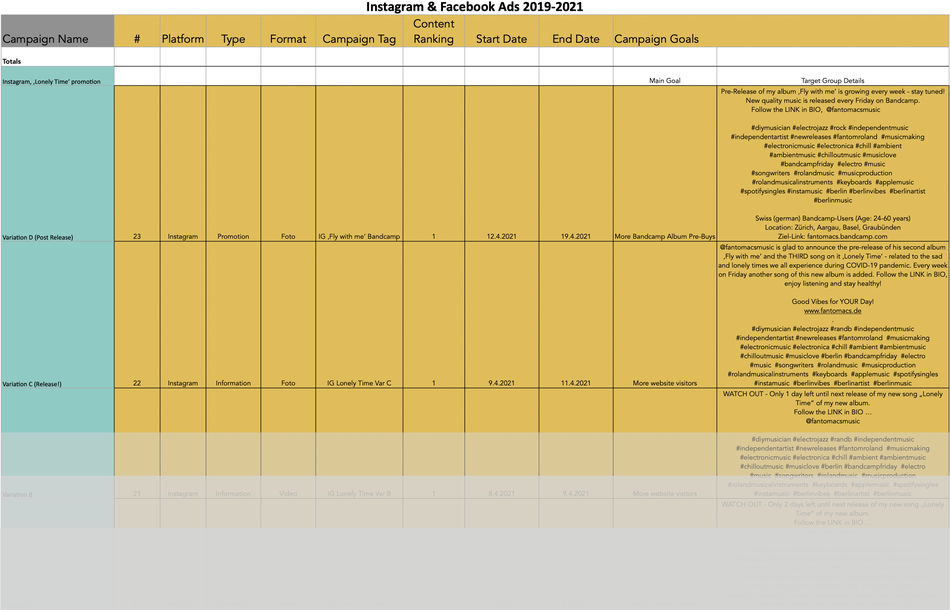
The final target groups and regions as well as the hashtags differed only slightly between the campaigns that were tracked in an Excel-style spreadsheet as depicted in the figure below (only a part of the large spreadheet is shown as example here).
Within the period of the campaigns from August 2020 to April 2021, more than 486.000 people were reached. Of those, approximately 4.900 homepage visits, corresponding to approx. 1% of the reached group of people. Approximately 40% of the new homepage visits belong to non-paid information campaigns. At the end of the entire 8-month-campaign, more than 1.355 new users visited the Homepage. As a side effect, the total number of new streams on the music platforms increased (approx. 19.420 overall streams) during this period. However, it should be noted that this was not the primary goal of the Ads campaign.
The Instagram Business Account offers additional options for non-paid information services. Hence, one gets some insights into the campaign like e.g. Impressions, Reach, likes, comments/reactions, how many impressions originate from hashtags, the starting page or the profile/other sources etc. Moreover, the number of interactions (like e.g. # of profile calls) can be discovered as well giving the opportunity to calculate CTRs.
Results of Non-Paid ("organic") Info Ads

The CTR - Click-Through-Rate (or Impressions-to-Click-Rate) - for the Instagram Ads range between 0.24% - 5.63% with an average of 1.78%. Interestingly, these data are actually higher compared to paid promotion campaigns (0.12% - 1.58%, average 0.68%).
In the music business the CTR for Instagram Ads has recently (Q1-2020) been reported to be in the order of 0.22% for feeds to 0.33% for stories (Source), whereas the CTRs for Facebook Ads are around 1.11% (newsfeed) but trend further downwards.
In conclusion, the Fantomacs promotions correspond to the average CTRs reported elsewhere and lie within the decreasing trend over the years.

The 'New Songs' campaign resulted in the highest Reach of all non-paid info campaigns done so far. More than 200 people have seen this information. On the average, 90 reaches can be expected (range: 40-200) for an information ad that is usually shown 24-48 to the audience.
The question is then what are the possible reasons for the differences in Reach seen in the above chart. Now, there are plenty of possible reasons:
Normally, video ads are regarded as more attractive to the Instagram audience catching more attention. However, the outcome of the campaigns performed so far is pointing towards the opposite.
The figures indicate that foto ads can generate up to 2-3x more reach than video ads. The hashtags used were comparable between these campaigns (refer to table shown above).
Collage (mix of fotos) and animation ads (fotos containing an animated portion) seem to rank somewhere in between pure fotos and videos in terms of the reach generated.


The primary objective for the non-paid information ads on Instagram was to generate ...
- visibility of the own website and
- interest for the blogs
Therefore, the website visits may be a reasonable output parameter to evaluate the effectiveness of the ads.
As shown in the diagram to the right significant differences were observed between the different information ads. The number of website visits ranged between 11 to 640 (average: ~140).
The by far best-performing was the info ad for 'Leave-It!' (Variation A) on Instagram. The difference to the other info ads was that in this case a link to the Fantomacs homepage was copied into the short text message. The website visitors originated in Switzerland, Germany, USA and Finnland. The majority of the visitors entered directly through the webpage (www.fantomacs.de) or through the link in bio (linktree), additional traffic was caused by the newsletter 'Zeitraffer Q3/2020' and other blogs. As a side effect, more than 80 streams were generated for 'Leave-It!' using the embedded player/s (not the primary goal of the ad).
Conclusions
Instagram Info Ads (non-paid ("organic")) are an effective tool to generate more website visits and interest / visibility to increase the fan base over time.
In the next part of this series, the performance of paid promotion ads will be described. A combination of non-paid and paid ads turned out to be more effective than pure "organic" advertisements (Soundcamps). Moreover, the creation of different advertising materials is certainly superior to just reposting the same content (fotos, collages, videos etc.) multiple times. However, the advertising materials should be designed in a consistent way to reflect the branding. In this respect, lots of efforts were invested recently to roll-out the "Fantomacs branding" across multiple websites & social media platforms.
So, stay tuned, keep reading this blog, enjoy listening to my music and take care!
Write a comment